Thousands of people visit your site every month, yet the number of orders and enquiries is lower than expected. The first question is usually "how do we get more traffic". Often a better question is: how many of the visitors we already have take the action we want?
The answer is the conversion rate. It shows with a single number how efficiently your ad budget, SEO traffic and site design work, and it sits underneath metrics such as CPA, ROAS and revenue.
In this guide we explain what conversion rate is, its formula, how it is calculated in GA4, the most common mistakes and practical ways to improve it. The numeric examples are for calculation purposes only and are not claims about real results.
Short answer: Conversion rate (CR) is the share of sessions or users that complete a defined goal action (purchase, enquiry, sign-up). Formula: conversions ÷ sessions (or users) × 100.
What is conversion rate
Conversion rate shows what percentage of visitors complete a goal action you defined in advance. That action is called a conversion and differs by business: an order in an online store, a quote request on an insurance site, a registration on a course site, a contact form submission on a B2B site.
Conversions come in two kinds. A macro conversion is directly tied to revenue (purchase, payment). A micro conversion is a small step towards it (add to cart, newsletter sign-up, click on a phone number). Tracking both separately shows where users drop off in the funnel.
Practical example
A furniture store in Baku tracks order form submissions as its main goal. The main CR relates to orders, and a secondary CR relates to clicks on the "Call" button. If you mix the two into one number, you cannot see which channel actually brings orders.
How to define a conversion
When defining a conversion, ask two questions: does this action create real value for the business, and can we measure it reliably? For example, a view of the "About" page is usually not a conversion but merely an interest signal. By contrast, a confirmed order or a successfully submitted contact form is a clear business outcome. For each conversion define a name, a trigger condition and, where possible, an average value (in AZN). This makes it easier to build ROAS and revenue reports later and ensures the word "conversion" means the same thing to everyone on the team.
Local context
On local sites a sale or enquiry often finishes by phone, so a click on the WhatsApp or call button becomes the key goal. Without tracking those clicks separately, CR does not reflect reality.
The CR formula: how to calculate conversion rate
The core formula is simple: conversion rate = conversions ÷ total sessions (or users) × 100. The result is a percentage. What you put in the denominator changes what the number means.
| Denominator | What it shows | When to use |
|---|---|---|
| Sessions | What share of visits ended in a conversion | Comparing channels, campaigns and pages |
| Users | What share of unique people converted | Long decision cycles, repeat visits |
| Ad clicks | Power to turn clicks into conversions | Google Ads and Meta Ads campaigns |
| Leads / enquiries | How enquiries turn into sales | Sales team effectiveness |
Calculation example
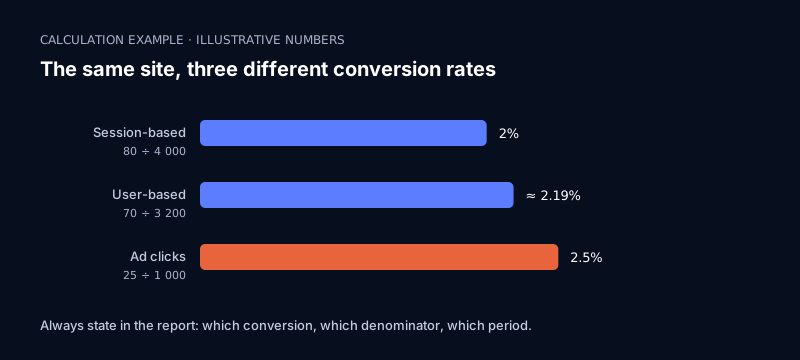
The numbers below are invented only to show the mechanics and are not real site results. Suppose a site had 4,000 sessions in a month and 80 orders.
- CR (session-based) = 80 ÷ 4,000 × 100 = 2%
- If the same period had 3,200 unique users and 70 of them ordered, CR (user-based) = 70 ÷ 3,200 × 100 = about 2.19%
- Looking only at ad traffic: 1,000 clicks and 25 orders = 25 ÷ 1,000 × 100 = 2.5%
As you can see, the same site can show three different CRs. So always state in a report which conversion, which denominator and which period. For a quick check you can enter numbers into our CPA / CPL calculator.
Checking with a conversion rate calculator
To use a spreadsheet as a calculator, two cells in Excel or Google Sheets are enough: conversions and sessions. In a third cell enter conversions ÷ sessions and apply percentage format. Separate rows for different channels make the picture clearer.
Conversion rate in GA4: key events and calculation differences
In GA4 the goals that used to be called "conversions" are now called key events. A key event is an event that matters to you, such as purchase, generate_lead or form_submit. You can read the official explanation in Google Analytics Help — About key events.
GA4 reports CR in two main metrics. According to Google's documentation, sessionKeyEventRate is the percentage of sessions in which any key event was triggered, and userKeyEventRate is the percentage of users who triggered any key event. The official definitions are on the Google Analytics API dimensions and metrics page.
| Metric | Basis | Good for |
|---|---|---|
| Session key event rate | Sessions | Comparing channels and landing pages |
| User key event rate | Users | Effectiveness at user level |
Why session and user rates differ
One user may visit the site three times in a month and order on the third visit. In a session-based calculation 1 of 3 sessions converted; in a user-based calculation 1 of 1 user converted. In fields with long decision cycles (insurance, real estate, loans) the user-based view is more realistic.
Practical check
- In GA4 Admin, mark the events that match your real business goal as key events.
- Check each key event's name and parameters: the same event must not be counted twice.
- In reports, split Session key event rate by channel and landing page.
- Compare the conversion count in the ad account with the GA4 number; if they differ, check the attribution model.
We explain how channel credit is split in our article on data-driven and last click models. We organise GA4 and GTM setup as part of our GA4 service.
How to read conversion rate by business type
What counts as a good CR depends on the business model, price and traffic source. There is no universal "good CR", and comparing with another site's number often leads to wrong conclusions. The most reliable comparison is your own history and your own channels.
E-commerce conversion rate
In an online store the main CR is the share of sessions that place an order. Split it into funnel stages: product page view, add to cart, checkout start, completed order. Once you see the biggest drop, you focus on the right place. Calculation example: of 1,000 sessions, 120 viewed a product, 30 added to cart, 12 started checkout and 8 completed an order. Overall CR is 0.8%, but the biggest drop is between product view and add to cart.
Lead generation (service sites)
In insurance, education or construction the goal is usually a form or a call. A lead and a sale are different things: CR measures lead creation, while conversion to sale must be tracked separately in the CRM. Otherwise a channel that brings many low-quality enquiries can look good.
Apps and sign-up flows
Here the conversion is a completed registration or first active use. Look at CR by channel, because free and paid traffic behave differently.
The most common CR calculation mistakes
Although conversion rate looks simple, it is one of the metrics most often calculated wrongly. The mistakes below either inflate the result or hide the real picture.
The most frequent mistakes
- Mixing denominators. One report uses sessions, another users or clicks, and the numbers do not match.
- Duplicate events. Refreshing the thank-you page sends purchase or form_submit twice and CR rises artificially.
- Marking every event as a key event. If trivial events such as scroll or page view count as conversions, CR loses its meaning.
- Including internal and bot traffic. Your own team's visits and spam traffic enlarge the denominator and lower CR.
- Drawing conclusions from a short period. Deciding on a day or two of data makes random fluctuation look like real change.
- Looking at all devices and channels together. Mobile and desktop CR often differ; a blended number hides the gap.
- Tracking loss. Consent banners and browser restrictions may mean some conversions are not recorded.
How to avoid them
Define one event name and one trigger condition for each conversion, test with GTM Preview, and compare the real number of orders with the CRM or store panel. These three steps keep tracking accurate. We describe the full KPI system in our marketing KPIs and GA4 guide.
Ways to improve conversion rate
Improving CR is less about "make the button red" and more about working in a logical order: first tracking must be right, then traffic quality, then page experience. The sequence below is the lowest-risk way to start.
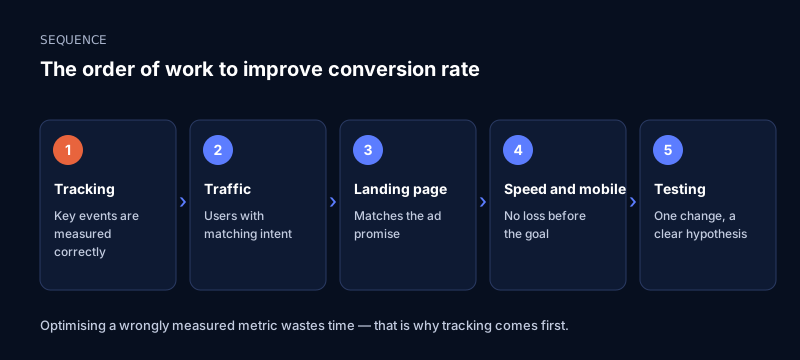
| Step | What to check | Tool |
|---|---|---|
| Tracking | Key events fire correctly and are not double-counted | GA4 reports, Google Tag Manager |
| Traffic | Search queries with the wrong intent | Google Ads search terms report, negative keywords |
| Landing page | Headline, offer and trust elements match the ad promise | Page review, A/B test |
| Speed and mobile | Mobile load speed, heavy scripts | PageSpeed Insights |
| Testing | Hypothesis, duration and enough data | A/B test plan |
1. Fix tracking accuracy
Optimising a wrongly measured metric is wasted time. Check that key events fire correctly, there is no double counting, and the ad platforms see the same goal as GA4.
2. Improve traffic quality
High traffic with the wrong intent lowers CR. In Google Ads, negative keywords, precise match types and audience restrictions help. In SEO, build the page to match the query intent: sending someone searching "what is" straight to a sales page does not improve CR.
3. Match the landing page to the query
Users should see the promise from the ad confirmed at the top of the page. Headline, price or offer, trust elements (reviews, certificates, contact details) and one clear CTA are the key elements. Shorten the form: every extra field is a barrier, so ask only what you really need.
4. Speed and mobile experience
A slow page that works poorly on mobile loses the user before they reach the goal. Optimising main images, reducing heavy scripts and making buttons easy to tap on mobile are first steps.
5. Test, but properly
In A/B tests change one thing at a time, write a hypothesis in advance and keep the test duration fixed. Stopping a test before enough data is collected leads to a wrong decision. Record every result so the next work builds on it.
Analysing conversion rate by segment
Overall CR is a kind of average temperature: it does not tell you what is wrong, but it can signal that something is. The real information is in segments. The CR of the same site can differ a lot by channel, device, new versus returning users, city and landing page.
The purpose of segmentation is to find the "worst" segment and fix it, and to learn from the "best" one. For example, if mobile CR is below desktop, the cause may be a form that is hard to fill in on mobile, slow loading or small buttons.
Which splits to look at
- By channel: organic search, paid search, social, direct and email traffic arrive with different intent and should be read separately.
- By device: mobile, desktop and tablet experiences differ; on local sites the mobile share is often high, so give mobile CR special attention.
- By landing page: comparing the CR of two pages in the same campaign shows which message works better.
- New versus returning users: returning users are usually closer to a decision; a lower CR among new users is normal.
- By geography: delivery, payment habits and price sensitivity can differ between Baku and the regions.
Calculation example
These numbers are for calculation only. Suppose a site has 4,000 sessions and 80 orders (overall CR 2%). Mobile had 3,000 sessions and 45 orders, desktop 1,000 sessions and 35 orders. Mobile CR = 45 ÷ 3,000 × 100 = 1.5%, desktop CR = 35 ÷ 1,000 × 100 = 3.5%. The overall 2% hides this gap, while segmentation shows you need to focus on the mobile experience.
A note on statistical reliability
In small segments (say, only 20 sessions a day) CR moves very quickly. One or two orders raise or lower the percentage noticeably. In such cases look at a longer period and wait until enough conversions are collected before deciding.
Conversion rate in ad channels
In paid channels CR directly affects cost: at the same cost per click, when CR rises the cost per conversion (CPA) falls. That is why it matters to track CR at page and campaign level in Google Ads and Meta Ads accounts.
Google Ads
In search campaigns user intent is visible in the keyword. Transactional queries ("order", "price", "buy") usually give a different CR from informational ones ("what is"). Group keywords by intent and prepare separate ad copy and a landing page for each group. The landing page experience part of Quality Score is also tied to CR.
Meta Ads
On social media people do not search, they discover. So for the same offer CR usually forms in stages: first attention, then return, then conversion. State the attribution window (for example, 7-day click and 1-day view) when reporting, because a different window gives a different conversion count.
Why platform and GA4 numbers differ
The ad platform calculates with its own attribution rules and GA4 with its own model. Sometimes the platform also counts post-view conversions, while GA4 shows only click-based sessions. The gap is natural; what matters is knowing the rules of both reports and explaining them to the client in the same language.
A practical checklist for a CR report
Before presenting a report to a client or team, go through the list below. It prevents the most common mistakes and builds trust in the numbers.
- Write the name and definition of the conversion (for example, "confirmed order", "submitted contact form").
- Choose the denominator: sessions, users or clicks; keep it the same throughout the report.
- State the period and the comparison period; account for seasonal effects (holidays, discount campaigns).
- Filter out internal and spam traffic.
- Reconcile the conversion count with the store panel or CRM.
- Split CR by at least channel and device.
- Next to the number, note which change (campaign, design, price) was made so the effect of the change is clear.
The list may look small, but in practice most contradictions in reports come from skipping one of these items. When everyone on the team works to the same definition, discussions focus on what to do rather than on whether the number is right.
The step after CR: CPA and ROAS
Conversion rate alone does not tell you about profit. An ad channel with a high CR but a very high cost can lose money. So read CR together with cost and revenue metrics.
Calculation example
Suppose a campaign spent 1,000 AZN, brought 500 clicks and 20 orders, and each order is worth 150 AZN. These numbers are invented for illustration. CR = 20 ÷ 500 × 100 = 4%. CPA = 1,000 ÷ 20 = 50 AZN. ROAS = (20 × 150) ÷ 1,000 = 3. If CR stays the same but the cost per click rises, CPA rises too, which is why the three metrics should be tracked together.
To run these calculations quickly, use the CPA / CPL calculator and the ROAS calculator. Both show the result as soon as you enter the numbers.
Frequently asked questions
What is conversion rate?
Conversion rate (CR) is the share of sessions or users that complete a goal action out of the total. The goal action can be a purchase, enquiry, sign-up or call.
How is conversion rate calculated?
Divide the number of conversions by the number of sessions (or users) and multiply by 100. As a calculation example, 4,000 sessions and 80 orders give a 2% CR.
What are conversions called in GA4 now?
Events that used to be called conversions in GA4 are now called key events. Reports use the Session key event rate and User key event rate metrics.
What is the difference between session-based and user-based CR?
Session-based CR shows what share of visits ended in a conversion, while user-based CR shows what share of unique people converted. The gap is larger where repeat visits are common.
What is a good conversion rate?
There is no universal number: it depends on the field, price, traffic source and the type of conversion. The most reliable comparison is between your own site's earlier periods and channels.
How can I improve e-commerce conversion rate?
First find where the biggest drop in the funnel is, then check tracking accuracy, the product page, the checkout flow and speed. Test changes one at a time.
CR is high but sales are not growing. What could be the reason?
If micro conversions (such as a newsletter sign-up) are marked as key events, CR can look high without revenue growing. Track the sales-related event separately and reconcile it with the CRM.
Conclusion
Conversion rate is the main measure of how valuable your traffic is. To calculate it correctly, define the conversion precisely, keep the same denominator and verify tracking accuracy. After that, improvement work becomes measurable.
As a next step, check your tracking setup, split the CR of your highest-traffic page by funnel stage and start with the stage where the drop is biggest. To speed up the calculations, use our CPA / CPL calculator.
Shall we review your GA4 tracking and conversion setup together?
GA4 service